As soon as I decided to add the 5x5 Blinkenlights matrix to the horn, it obviously needed to be turned into a music visualiser.
Googling for “mopidy audio visualizer” found this post, where someone did exactly that. But it wasn’t on a Pi, ran some other software, didn’t talk to a 5x5 matrix, and - frankly - I’d always wanted to write one myself.
The 5x5 display I added has 25 individually addressable RGB pixels. Each pixel has separate R, G, B channels, each of which takes an intensity value between 0 and 255.
I’m going to just keep all the pixels the same colour, but map different parts of the audio frequency domain to Red, Green and Blue during playback:
- low frequencies => Red (0 -> 250Hz)
- medium frequencies => Green (250->2000Hz)
- high frequencies => Blue (2000Hz+)
The amount of each frequency present at any one time will dictate the intensity of each colour.
Getting the Audio Data
Although I decided to build the visualiser code myself, the above post did give me the info on how to get the audio data out of mopidy (the following is from my mopidy.conf, slightly adapted to the horn):
[audio]
output = tee name=t ! queue ! alsasink device=hw:sndrpihifiberry t. ! queue ! udpsink host=127.0.0.1 port=5555
Mopidy uses gstreamer internally to do its audio processing. The above instructs it to send the audio to the alsa device hw:sndrpihifiberry as normal, and also to send it on UDP port 5555 to localhost.
Cool, lets see what that looks like with tcpdump -i lo -p udp port 5555 -v (tcpdump is the first tool I install on any system):
[root@musicalhorn adq]# tcpdump -i lo -p udp port 5555 -v
tcpdump: listening on lo, link-type EN10MB (Ethernet), snapshot length 262144 bytes
22:19:59.006572 IP (tos 0x0, ttl 64, id 41515, offset 0, flags [DF], proto UDP (17), length 8220)
    localhost.50489 > localhost.personal-agent: UDP, length 8192
22:19:59.055710 IP (tos 0x0, ttl 64, id 41518, offset 0, flags [DF], proto UDP (17), length 8220)
    localhost.50489 > localhost.personal-agent: UDP, length 8192
...
Great, so we get 8192 byte packets stuffed with audio. Now, lets capture some and see if it sounds sensible.
So with netcat, I recorded a few seconds of data: nc -lu -p 5555 > test.audio
I scped it back to my laptop and played it with aplay test.audio -f S16_LE -r 44100 -c 2
Hmm weird, it was sort of the right tones, but it seemed totally scrambled. Cue slightly frustrating debugging montage digging into alsa devices and the mopidy codebase.
After a while I realised, Duh, its UDP, so the packets arrive in whatever order they feel like. I confirmed this by temporarily using TCP as the delivery method (it guarantees that packets will be received in the same order they’re sent):
Mopidy config
output = tee name=t ! queue ! alsasink device=hw:sndrpihifiberry t. ! queue ! tcpclientsink host=127.0.0.1 port=5555Netcat
nc -l -p 5555 > test.audioRecord, scp, play, and the audio is now perfect! So that confirms that I get raw PCM audio data, there are no wacky headers and it is 44.1kHz signed 16 bit little endian with two channels (aka “standard” CD audio PCM).
Of course, for this purpose, I actually don’t care if the packets are a bit disordered or some go missing: I’m writing a music visualiser. UDP is the perfect low-overhead protocol for it since no one is going to actually listen to this raw audio stream.
Mapping Audio To RGB
The audio I’m receiving is your standard PCM: a series of regularly spaced samples in time. So, you can easily say “at 20ms into the audio, the value was 5678”.
But I need a frequency breakdown. To do that, you use the FFT algorithm: Fast Fourier Transform. This algorithm translates audio-as-samples-by-time into audio-as-samples-by-frequency. Why “Fast”? I assume it was just faster than the previous algorithms.
So, instead of an array of samples indexed by time, you have an array of samples indexed by frequency. So - for example - if you wanted to find out how much high pitched screeching there was in a fourier-transformed audio sample, you can simply access the array entries that correspond to high audio frequencies (eg > 20kHz).
You can even filter them out entirely: simply set the high frequency array entries to zero, and use the handy “Inverse FFT” algorithm (Not Appearing In This Film) to turn them back into normal time-based audio samples (and then play it!).
I’m glossing over a lot here, for example, the FFT data is actually all complex numbers, but for this purpose, this is not important.
I didn’t want to write this all stuff myself though; numpy is the obvious choice (we use numpy a lot at work for Big Data analysis). From Wikipedia, “numpy adds support for large, multi-dimensional arrays and matrices, along with a large collection of high-level mathematical functions to operate on these arrays”.
It has a convenient Python language interface, but at its core it has a burning heart of purest Fortran. Basically it lets you do multidimensional matrix operations really easily and really efficiently.
However, (a) I hadn’t done anything with fft for a while, and (b) I’d never done it in numpy, so I didn’t know its exact API. Cue Googling montage..
Some time later, I had found this article and this article . Neither was quite complete, but I figured it all out from their pointers:
- Read audio data
- FFT it into frequency based domain
- Compute the “spectral power” (basically how much of each are present in the sample) of low, medium, and high frequency bands.
- For all the frequency entries in each band, you basically calculate
square(abs(the value)). You then sum them all together to get the total power for that band. Oh BTW - thatabs()step is how we’re getting rid of those pesky complex numbers.
- For all the frequency entries in each band, you basically calculate
- Divide each band’s spectral power by the total spectral power for the audio data. This yields a number between 0 and 1 for each of the three bands.
- Finally, multiply those by 255 to get the R, G, B components to send to the display.
UDP Plumbing
Receiving the UDP data is done using python’s standard socket library with a few really specific optimisations:
# init the socket we receive data on
sock = socket.socket(socket.AF_INET, socket.SOCK_DGRAM)
sock.bind(('127.0.0.1', UDP_PORT))

# 1 second receive timeout so we can clear the display on stop
sock.settimeout(1)

# set the socket internal buffering to a few packets so we always get the latest samples and not a
# huge buffer of out of date data
sock.setsockopt(socket.SOL_SOCKET, socket.SO_RCVBUF, AUDIO_PACKET_SIZE * 5)
Putting It All Together
Finally, combining all the pieces above, the sample code from Pimonori, and yet more tweaking, we have the completed visualiser code. It’s also available on my Github repo here:
import numpy
import socket
import time
from rgbmatrix5x5 import RGBMatrix5x5


AUDIO_PACKET_SIZE = 8 * 1024
UDP_PORT = 5555
MID_FREQ_BAND_START_HZ = 250
HIGH_FREQ_BAND_START_HZ = 2000

# calculate array indexes that our three frequency bands start at
# bufsize / 2 / 2 'cos there are two bytes per audio sample and there are also two audio channels
midstartidx = 0
highstartidx = 0
fft_freqs = numpy.fft.rfftfreq(int(AUDIO_PACKET_SIZE / 2 / 2), 1 / 44100)
for i, f in enumerate(fft_freqs):
    if f < MID_FREQ_BAND_START_HZ:
        midstartidx = i
    elif f < HIGH_FREQ_BAND_START_HZ:
        highstartidx = i

# init the rgb matrix
rgbmatrix5x5 = RGBMatrix5x5()
rgbmatrix5x5.set_clear_on_exit()
rgbmatrix5x5.set_brightness(0.8)

# init the socket we receive data on
sock = socket.socket(socket.AF_INET, socket.SOCK_DGRAM)
sock.bind(('127.0.0.1', UDP_PORT))

# 1 second receive timeout so we can clear the display on stop
sock.settimeout(1)

# set the socket internal buffering to a few packets so we always get the latest samples and not a
# huge buffer of out of date data
sock.setsockopt(socket.SOL_SOCKET, socket.SO_RCVBUF, AUDIO_PACKET_SIZE * 5)

# setup the PCM datatype for numpy -- S16L
pcm_dt = numpy.dtype(numpy.int16).newbyteorder('L')

# main loop
display_cleared = False
while True:
    # try and get some data, and swallow timeouts
    try:
        buf = sock.recv(AUDIO_PACKET_SIZE)
    except socket.timeout:
        buf = None

    # no data => just clear the display and keep going
    if not buf:
        if not display_cleared:
            # only clear it if we haven't already -- this knocked the idle cpu usage down completely.
            rgbmatrix5x5.clear()
            rgbmatrix5x5.show()

            display_cleared = True
        continue

    # load in the raw data, interpreting it as little endian signed 16 bit
    pcm = numpy.frombuffer(buf, dtype=pcm_dt)

    # reshape the input array into two columns (since its interleaved L+R channels)
    pcm = numpy.reshape(pcm, (int(len(pcm) / 2), 2))

    # average the L+R channels together into a single value
    pcm = pcm.mean(axis=1)

    # perform an FFT to shift to frequency domain
    freq = numpy.fft.rfft(pcm)

    # calculate power of each individual frequency
    freq_power = numpy.square(numpy.abs(freq))

    # now calculate power of each frequency band, as well as the total frequency power for this data chunk
    low_band_power = numpy.sum(freq_power[: midstartidx])
    mid_band_power = numpy.sum(freq_power[midstartidx: highstartidx])
    high_band_power = numpy.sum(freq_power[highstartidx:])
    total_band_power = low_band_power + mid_band_power + high_band_power

    if total_band_power:
        # map the frequency bands to R(low) G(mid) and B(high) and update the display
        r = low_band_power / total_band_power
        g = mid_band_power / total_band_power
        b = high_band_power / total_band_power
        rgbmatrix5x5.set_all(int(r * 255), int(g * 255), int(b * 255))
        rgbmatrix5x5.show()
        display_cleared = False

    else:
        # ... unless the sound was all zero => just wipe the display rather than crashing!
        if not display_cleared:
            rgbmatrix5x5.clear()
            rgbmatrix5x5.show()
            display_cleared = True

    # sleep a bit
    time.sleep(0.05)
Summary
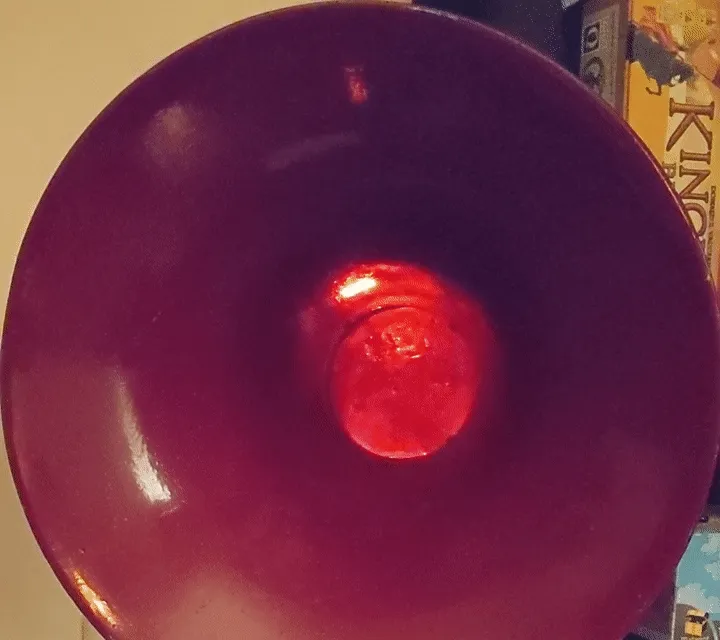
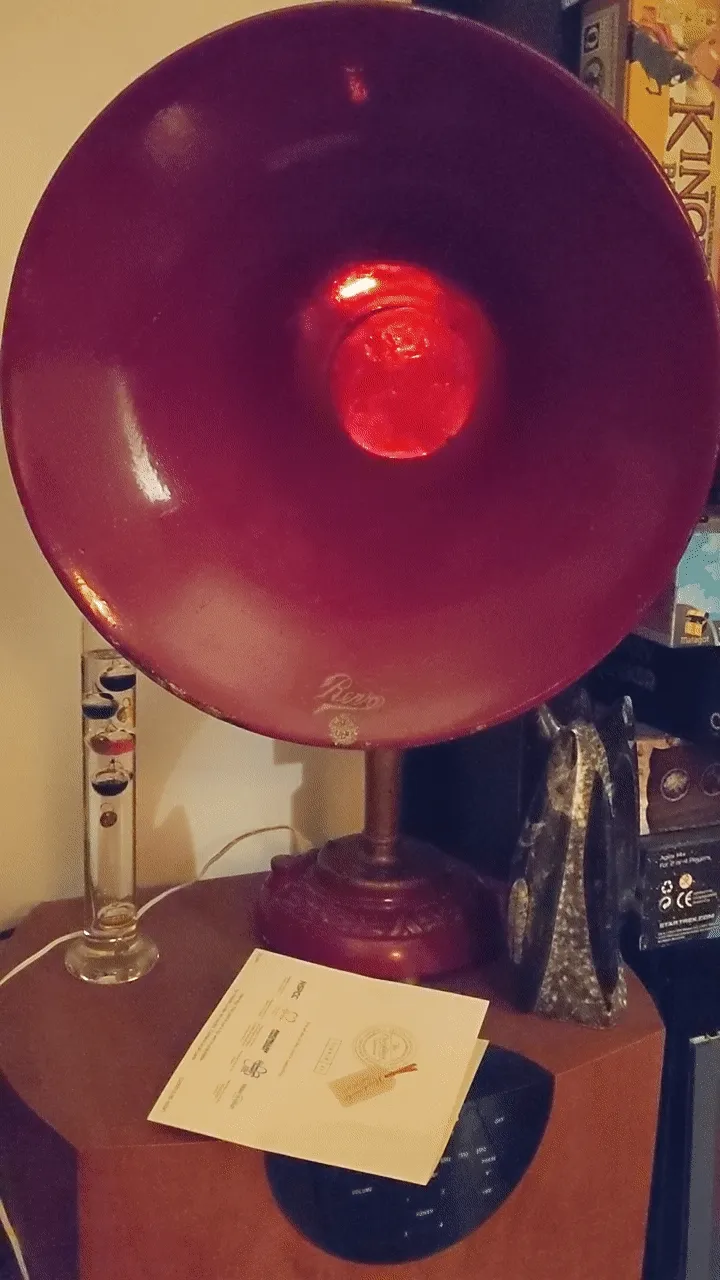
It actually works really well! You can see it responding to the music: the colours are quite different depending on the type of music you’re listening to.
When not playing music, no UDP data is received, so the visualiser code pretty much goes to sleep, using minimal CPU.
Here’s a short GIF of it playing The Hu’s “Wolf Totem”- lots of bass, so lots of red! :)
Leave a comment
Comments are moderated, so yours won't appear immediately. Your email is never published.