I’ve been watching a lot of the Technology Connections Youtube channel recently. I was particularly intrigued by the series on RCA CED VideoDiscs. There’s also some information available on Wikipedia.
These are Vinyl discs, very similar in concept to a Vinyl (audio) disc, except these contained video rather than audio. Unlike LaserDiscs which… use lasers, VideoDiscs are still played with a stylus.
The data is read with a diamond stylus, and is apparently an “FM encoded” analogue video and audio stream. The data is encoded in the depth of the track (the tracks do not “wiggle” from side to side), and extracted using capacitance between the stylus and the (carbon-doped for conductivity) Vinyl disc. This explains their name Capacitance Electronic Disc.
I was so interested, I ended up buying a couple from Ebay (they actually released this format in the UK in the early 80s, so some examples are cheap to acquire). I’m not actually interested in playing them, but I do think they look kinda cool; I’ll probably end up sticking them on the wall :)
I really enjoy reverse engineering things: these discs piqued my interest for an afternoon, so prepare yourself for waaay too much information on RCE disks!
CEDs Disc Overview
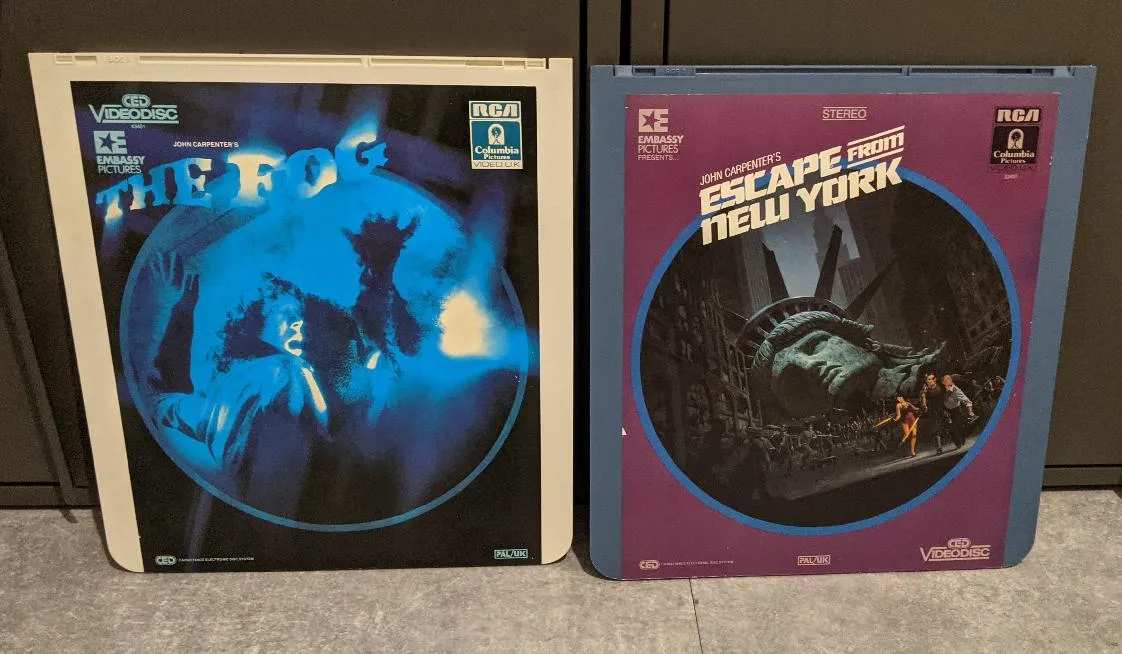
The above is a picture of the caddies the discs are held in. (Also, I’ve got a sort of John Carpenter movie thing going on here)
The discs themselves are quite interesting:


On the left you can see they really do look like vinyl audio discs. However, the track density is so huge, that if you catch them at the right angle, you get some weird prism effects. I’m wondering is this is a sort of Fresnel lens effect going on here: remember, these are black vinyl discs; they’re not based on reflection like laser based disc storage.
Most people didn’t see this coolness though: originally RCA were going to just have people handle the plain discs, but then found dust particles tended to bond onto the disc, severely breaking playback. So, they came up with the idea of the caddy to hold the disc. You inserted the caddy into the player and it extracted the disc for playback. When it was finished you put the caddy back in and it returned the disc to it: no contact with dirty humans. :)
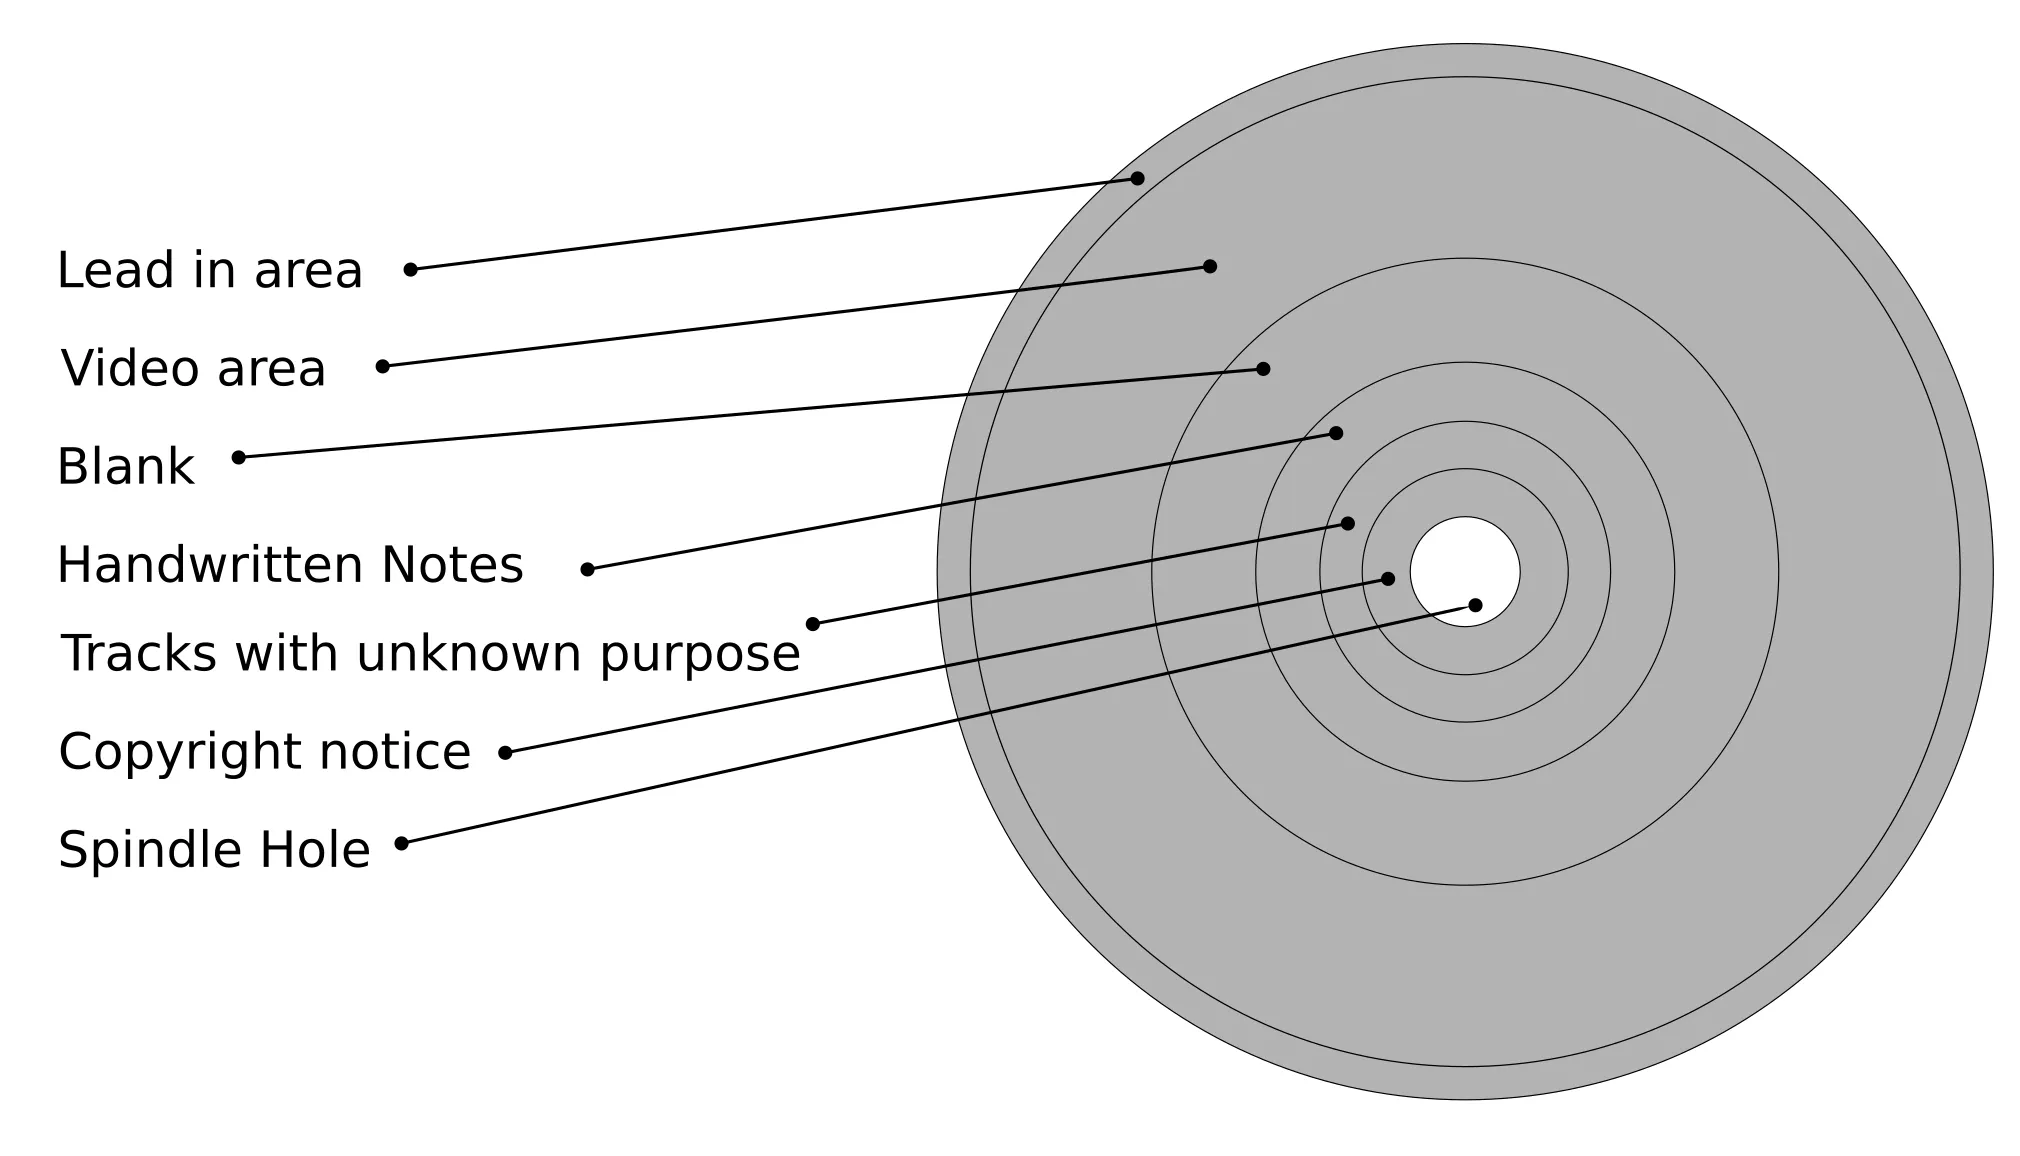
The disc seems to have some distinct areas:
Video Fields on the Disc
Looking a bit closer, you can actually see the data on the disc: its divided into 8 video fields per revolution.
A field is a half-vertical-size video frame including either the odd lines or the even lines of the video frame, caused by bandwidth issues in legacy analogue video technology. Normally I would complain, but this is legacy analogue video technology, so it makes total sense here.

In the above you can see the tracks in one of the eight segments of the disk: clearly most of the data will be for video, but there’s an additional smaller amount of data that looks different. Its quite interesting that they all line up: clearly the discs rotate a constant speed.
Diagram of a disc field segment:

The dotted line above shows a single field’s worth of data running through this segment: video and also the mysterious ??? data.
Digression: How Cathode Ray Tubes Work
Before we go any further, we need to have a short digression on how CRT technology works.
CRTs draw a picture on the screen by scanning a beam of electrons from left to right, from the top of the bottom of the screen, using something like the following pattern:

- The solid lines are the actual visible lines of the picture.
- The six diagonal dotted lines between them are not visible, but they show the movement path taken by the electron beam to move back to the left hand side to draw the next line: this takes time called the Horizontal Blanking Interval.
- The single diagonal dashed line from bottom right to top left is also not visible, but it shows the movement path of the electron beam to move back to the top left for the next frame of video: this also takes time called the Vertical Blanking Interval.
Why this is important? Because these intervals are encoded on the disc and are visible to the naked eye!
A Closer Look At A Field Segment
Let’s have a closer look a single segment using the revolutionary technique of… moving the camera nearer: (Eeek, look at all the dust!)

Examining the video part of the upper segment in the photo, there appears to be a pattern of faint horizontal stripes within it. Let’s have a closer look at that under the microscope:

The absolutely tiny vertical grooves in the above are the grooves the data is stored in, as read by the stylus. The horizontal lines are the pattern we saw in the image above, dividing it up into broad “stripes”. So what is it?
I think the thinner horizontal lines are the time for the Horizontal Blanking Interval, so the data in the wide “stripes” is a single line to be shown on the TV. If we look at another microscope picture, with the light angled slightly differently:

You can actually see the patterns of the stored video in the lines in this one! (You have to adjust the lighting angle quite precisely to make them show up)
Each of the three broad horizontal stripes above contains the data for a particular line of the picture.
As you move your eyes from right to left along one of the stripes above you’re basically moving forwards through the time for that particular line in the movie, which is pretty cool!
Confirming The Video Data Idea
Assuming these features are the lines of the picture, we should be able to confirm this by physically measuring the length of the data. I was originally going to try and do that with a bit of string, but that proved unfeasible.
Instead, using some simple maths, we can calculate the length of a line on disk in millimetres:
- I measured the radius of the start of the video area as 148mm.
- Plugging that into the standard calculation for the circumference of a circle gives a length of 929mm.
- There are 8 frames of data, which gives 929/8 == 116mm per frame of data.
- However, that includes the mysterious ??? section: I measured the length of that very roughly with my digital calipers, and made it about 7mm.
- This means the length of the video data is 109mm.
- A PAL video signal has a frame resolution of 720x576, so each field will have 288 lines.
- This means the length of a video line on disk should be 109/288, or 0.38mm.
Next I had to confirm the length of a line through the microscope, which proved… tricky. I took a picture of the lines through the microscope eyepiece: (this was quite tricky to do given the visual distortion caused by disc itself)

- I counted the number of stripes I could see: ~6.
- Next, I needed to measure the size of the viewfinder image in millimetres. So, I measured my ruler under it:


- On the right you can see two of the millimetre markings of the ruler through the eyepiece. I make it about 2.1mm
- So, that means 6 video lines take up about 2.1mm.
- For a full PAL field, we should expect (2.1 / 6) * 288, which equals 100mm.
- We’re short by 9mm from our calculation above, but given the roughness of the measurements I’ve used here, I think its close enough - for me - to confirm my hypothesis that this data is the PAL video signal.
The ??? Data
I managed to get a picture of the boundary between the ??? data and the video data:

- At the very top you can see ~2 lines of the video data.
- Then below that (the edge of the ??? data), you can see the stripes occur twice as frequently.
- Each ??? stripe appears to occupy half the space of a normal video stripe.
- So… we measured roughly 7mm for this data, so using the figures we calculated above, that gives us (7 / 0.38) = space for ~18 normal video lines.
- Since the ??? stripes appear to be half as wide, there are (2*18) = ~36 mini-stripes.
- In the picture above, there are three groups of 5 ??? stripes (you can just see the start of the third group at the bottom left). Each group of 5 is clearly distinct from the others.
I’m going to guess this is where the audio data lives, possibly stored in the Vertical Blanking Interval. I can’t tell much more than that though.
Bonus Legacy Analogue Audio Tech!
If you look back at the picture of the caddies above, you’ll see one is white and one is blue. This colour coding told the user about the audio encoding.
A white caddy implies “normal” audio. A blue caddy implies the audio was encoded using the CX system (here’s a picture of its logo from the back of the blue caddy):
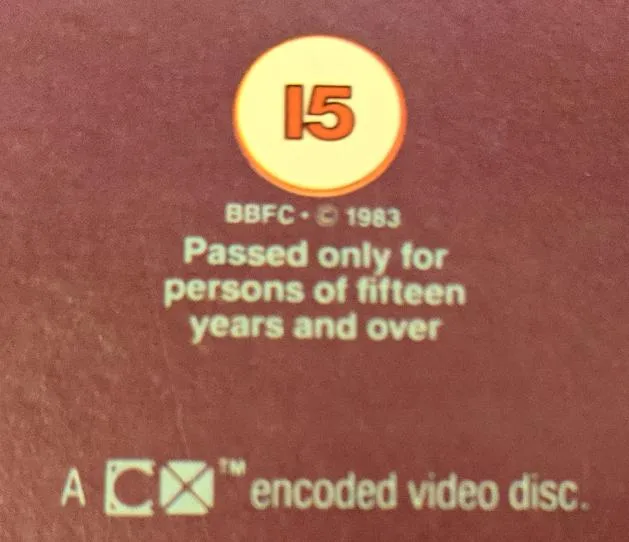
CX was a manipulation of the audio stream designed for vinyl audio discs. It reduced contact noise caused by the stylus’ contact with the disc whilst playing.
To get the benefit of CX, you needed a vinyl player equipped with extra circuitry to decode it. However, it was also advertised as being back compatible with existing non-CX equipment: you could play it on a conventional record player and not hear any change in the audio (although you didn’t get the noise reduction without a CX player).
Most people could not hear the difference. However, recording engineers, who were responsible for mastering the original audio could hear it, and many then refused to work with CX as they were unhappy with the resulting distortion of their hard work.
You can find out much more on this at Techmoan’s video on the subject, including playback with CX enabled and disabled.
At this point, I’m about done with playing with these; its been a fun afternoon with a microscope :)
1 Comment
SarahC ·
Fascinating! Thanks for the analysis.